
Let us take debugging forward with the top 5 best debugging tools for coders in 2023. Learn how to debug smart, not hard.
Debugging tools or software applications are used to specify and fix software code errors, bugs, and problems. They can follow errors and specific issues, making it more convenient for developers to fix them. Various debugging tools are available for other programming languages and operating systems.
We will discuss the top 5 practical coding debugging tools for 2023 in this article. These tools have been developed to make it faster and more useful to find and fix problems.
Debugging is important to verify the quality of our code. This allows us to find and fix errors that can cause random behavior and cracks. By fixing these errors, we will improve the reliability and power of our software, making it more useful to our users.
We can improve the performance and efficiency of our code by debugging. We will be able to improve the user experience and overall performance of our program by detecting and resolving performance issues.
There are many strategies and ideas we can use to make debugging less time-consuming and frustrating for us.
- Reproduce the issue: Try to reproduce the issue consistently, so that you can isolate and diagnose the problem.
- Use print statements: Add print statements to the code to track variables and understand the flow of the program.
- Use a debugger: A debugger allows you to step through the code line by line, inspect variables, and set breakpoints.
- Check the logs: Logging can help you understand what’s happening in your code and often provides useful information for debugging.
- Isolate the problem: Try to isolate the problem to a single function or module to make it easier to debug.
- Check the documentation: Check the documentation of the libraries and APIs you are using to ensure that you are using them correctly.
- Rubber duck debugging: Explain your code and the problem you are trying to solve to a rubber duck or a colleague. This often helps to clarify your thoughts and find the solution.
- Test incrementally: Test small changes to your code, so that you can quickly identify which change caused the issue.
- Test with edge cases: Test your code with edge cases to ensure that it works correctly under different conditions.
- Take breaks: If you get stuck, take a break and come back to the problem later with a fresh perspective.
These tips and tricks can make debugging easier and more efficient. By following them, you can save time and find the root cause of the problem faster.
Some popular debugging tools include:
1. GDB (GNU Debugger)
GDB, the GNU Debugger, is a powerful tool used by developers for debugging programs written in C and C++. It allows developers to inspect the state of a program at any given moment during its execution, which is useful for identifying and fixing errors in the code. GDB can be used to inspect variables and memory, trace program execution, and control the execution of the program.

GDB provides a command-line interface, which allows developers to enter commands to inspect and control the program. This makes it ideal for use in text-only environments, such as remote servers or in terminals.
In addition, GDB can also be integrated with other development tools, such as text editors and Integrated Development Environments (IDEs), to provide a more streamlined debugging experience.
Some of the key features of GDB include:
- Support for multi-threaded programs
- Support for core dumps and post-mortem debugging
- Ability to inspect variables and memory
- Breakpoints and watchpoints for controlling program execution
- Support for remote debugging, which allows debugging of programs running on remote systems
GDB is widely used and is considered to be one of the most powerful and flexible debugging tools available. It is particularly useful for debugging complex, large-scale programs, and is an essential tool for any C or C++ developer.
2. Visual Studio Debugger
The Visual Studio Debugger is a debugger integrated with Microsoft Visual Studio, an Integrated Development Environment (IDE) for Windows development. For programmers working on Windows programs, including those created in C++, C#, and other.NET-based languages, it offers a complete debugging environment.
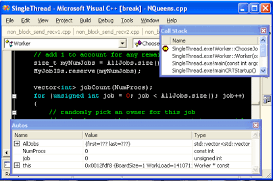
With the help of the Visual Studio Debugger, developers may easily investigate variables, call stacks, memory, and other debugging-related objects. Additionally, it offers functions like breakpoints, watchpoints, and tracepoints that give programmers control over how their code is executed and how it behaves.
Developers may transition between developing and debugging jobs with ease thanks to the Visual Studio Debugger’s integration with other Visual Studio capabilities like the code editor and the integrated development environment (IDE).
The access to other tools and services made possible by this integration, including performance profiling and code analysis, can be utilized in conjunction with the debugger to raise the overall standard of the code.
The following are some of the main attributes of the Visual Studio Debugger:
- Support for parallel and multi-threaded debugging
- the capacity to debug software running on distant systems
- support for memory analysis and coding diagnostics
- Integration with the historical debugging experience offered by IntelliTrace in Visual Studio
- Debugging assistance for managed and native code.
The Visual Studio Debugger is an indispensable tool for Windows development since it is robust and strong overall. Developers can more easily find and repair bugs in their code thanks to the robust debugging environment it offers and how it integrates with other development tools and services.
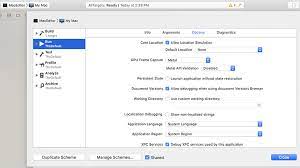
3. Xcode debugger
Xcode Debugger is a debugger integrated with Apple’s Xcode development environment, used for developing software for iOS and MacOS platforms.
Xcode Debugger provides an intuitive user interface for debugging iOS and MacOS applications, allowing developers to inspect the state of their programs and find and fix errors in their code.
A wide range of capabilities offered by the Xcode Debugger makes debugging easier. Developers can use it to set breakpoints, examine variables and their contents, observe the call stack, and check the program’s memory state.
Developers can quickly debug intricate, multi-threaded apps thanks to the Xcode Debugger’s support for multi-threaded debugging.
The Low-Level Debugger (LLDB) command-line interface and the visual interface of Xcode are two more Xcode components that the Xcode Debugger integrates with. This shortens the time it takes to detect and resolve bugs in iOS and MacOS applications by providing a straightforward and effective methodology.
Debugging is additionally supported by Xcode Debugger on real iOS and MacOS devices as well as in the iOS and MacOS Simulator. Developers may test their applications on the same gadgets that users will be using thanks to the comprehensive testing environment this offers.
Overall, the Xcode development environment is strongly connected with the Xcode Debugger, which is a strong and user-friendly debugger. An indispensable tool for every iOS or MacOS developer, it offers developers a complete debugging solution for creating iOS and MacOS applications.
4. LLDB
LLDB is a debugger used for Swift, Objective-C, and C++ programming languages. LLDB is part of the LLVM (Low-Level Virtual Machine) project and was designed as a high-performance alternative to GDB. LLDB provides a modern, flexible and efficient debugging experience for developers working on macOS and Linux platforms.
LLDB offers a command-line interface as well as a graphical user interface through the Xcode-integrated development environment. In addition, LLDB provides an API that can be used to build custom debuggers or integrations with other development tools. Some of the key features of LLDB include:
- Debugging support for multiple processes and threads
- assistance with conditional breakpoints and watchpoints
- being able to examine variables and memory
- dynamic type information, which enables programmers to work with variables in-place
- support for optimizing code debugging
Apple platform developers frequently employ LLDB, which is regarded as a cutting-edge, effective, and trustworthy debugger. It is a crucial tool for developers working on these platforms and is particularly helpful for debugging intricate and substantial Swift and Objective-C apps.
5. Chrome DevTools
Chrome DevTools is a set of debugging and inspection tools built into the Google Chrome web browser. It gives developers a set of tools to examine, troubleshoot, and improve web pages and web applications. DevTools is an effective tool for web development since it allows for real-time HTML, CSS, JavaScript, and other web technology inspection.
Each of the panels in the DevTools interface offers a distinct set of functions. The Elements panel, which offers a view of the page’s HTML and CSS, and the Console panel, which offers a JavaScript debugging console, are two of the panels that are most frequently used.
Along with a Speed panel that offers details on the page’s performance and resource utilization, DevTools also includes a Network panel that enables developers to examine network requests and responses.
DevTools offers a number of extra tools for web page optimization in addition to its basic debugging features. These tools include the Audits panel, which offers performance recommendations and optimization suggestions, and the Lighthouse panel, which offers an automated performance report.
Any web developer needs Chrome DevTools since it offers a full suite of tools for debugging, examining, and optimizing websites and applications. For developers of all skill levels, it is the perfect option because it is simple to use, quick, and easily interacts with Google Chrome.
Stackoverflow.com is a website that offers knowledge and resources for debugging tools. It is a fantastic resource for discovering troubleshooting solutions and advice because it provides a huge collection of queries and answers from developers all over the world.
Read also:-Learn Coding for Free Online with Certificate in 2023
Dev.to is another website that offers resources and information about debugging tools. Developers can contribute their knowledge and experiences on a variety of programming issues, including debugging, on this community-driven website.
Additionally, there are courses and articles that can teach developers how to use various debugging tools efficiently.
The Microsoft Developer Network (MSDN) website is another one worth mentioning. It offers articles, tutorials, and how-to manuals as well as other resources and information about the Visual Studio Debugger.
Overall, debugging tools are a crucial step in the creation of software since they help guarantee that the code is working properly.
Developers must select the best tool for their unique needs from a variety of options, each with strengths and shortcomings of its own.
Websites like stackoverflow.com, dev.to, and MSDN can offer developers useful resources and information to improve their debugging abilities.
How to use these tools effectively
Using the right debugging tool for the job is key to debugging effectively. The following section will provide step-by-step instructions on how to use each of the top 5 debugging tools effectively.
- GDB (GNU Debugger):
- Compile your program with the -g option to include debugging information
- Run gdb with the name of the executable as an argument
- Use the “break” command to set breakpoints
- Use the “run” command to start the program
- Use the “next” and “step” commands to step through the code
- Use the “print” command to inspect variables and expressions
- Visual Studio Debugger:
- Set breakpoints by clicking in the left margin or using the “Debug > Toggle Breakpoint” menu
- Start debugging using the “Debug > Start Debugging” menu or the F5 key
- Step through code using the “Debug > Step Over” or “Debug > Step Into” menu or the F10/F11 keys
- Inspect variables by hovering over them or using the “Debug > Windows > Autos” or “Debug > Windows > Locals” windows
- Xcode Debugger:
- Set breakpoints by clicking in the left margin or using the “Editor > Breakpoints” menu
- Debug by launching with “Debug > Run” or the “Cmd + R” key.
- stepping through code using the “Debug > Step Over”/”Debug > Step Into” menu or “Cmd + ‘” keyboard shortcut.
- Inspect variables by clicking on the variables in the debug area or using the “Debug > Debug Workflow > View Variables”
- LLDB:
- Compile your program with the -g option to include debugging information
- Run lldb with the name of the executable as an argument
- Setting breakpoints can be done using the “breakpoint set” command.
- Use the “run” command to start the program
- Use the “next” and “step” commands to step through the code
- Use the “print” command to inspect variables and expressions
- Chrome DevTools:
- Open DevTools by clicking on the “More Tools > Developer Tools” menu in Google Chrome
- Set breakpoints in the “Sources” tab by clicking on the line number
- Start debugging by reloading the page or running the JavaScript code from the DevTools console
- Step through the code using the “Step Over”, “Step Into”, and “Step Out” buttons
- Inspect variables by hovering over them or using the “Watch” section of the “Scope” tab.
Note: These are just general guidelines and the exact steps may vary slightly depending on the version you’re using.
1. What are some of the best debugging tools for coders in 2023?
The top best 5 debugging tools for coders in 2023 are Visual Studio Code, Chrome DevTools, Node.js Debugger, Xdebug, and GDB.
2. What is the purpose of debugging tools?
The purpose of debugging tools is to help software developers identify and fix errors (also known as bugs) in their code. Debugging tools provide features such as setting breakpoints, inspecting variables, and tracing the execution flow of the code, which can make the debugging process faster and more efficient.
3. Are there any differences between debugging tools for different programming languages?
Yes, there are differences between debugging tools for different programming languages. The features and capabilities of debugging tools can vary depending on the programming language they are designed for. For example, a debugging tool for a statically typed language like C++ may have features for inspecting the type of variables, while a debugging tool for a dynamically typed language like Python may focus more on providing interactive access to the running program.
4. How do debugging tools work in a team environment?
When using debugging tools in a team setting, it is easier for multiple developers to collaborate on fixing code errors because they present a centralized view of the debugging process. Additionally, debugging tools may have capabilities that allow team members to exchange data about the state of the program and the debugging process, such as call stacks, variable values, and breakpoints.
5. Are there any disadvantages to using debugging tools?
Using debugging tools has the drawback of slowing down program execution, especially if the purpose of the tool is to provide high-level information about the program’s operation. In addition, some debugging tools can be challenging to use, especially for engineers who are unfamiliar with the tools or debugging process. Finally, some debugging tools may not work properly in all programming environments or languages and may require additional setup or configuration.
6. How do debugging tools help to find errors in code?
Debugging tools help discover coding problems by providing details about the state of the running program. Variable values, the call stack, and the currently running line of code can all be included in this data. Developers can study this data to find problems and determine what caused them.
Read also:- top 7 best-coding-challenges websites in 2023